Sending an email marketing campaign without analyzing its performance data is like driving a vehicle with a covered dashboard. You might be moving forward, but you have no accurate way of knowing your speed, direction, or fuel level. In the digital space, data data acts as your navigation system.
Many business owners choose an email platform based solely on its visual templates or pricing structures. However, the true value of an email service provider often lies in its data reporting backend. Without clear, actionable data insights, optimizing your strategy over time becomes almost impossible.
This comprehensive guide breaks down the core concepts of email reporting. We will conduct a neutral, side-by-side feature comparison of two major platforms: Constant Contact and Campaigner. By focusing on how each software handles data, tracking, and performance dashboards, you can determine which system fits your specific analytics requirements.
What Is Email Analytics and Reporting?
In email marketing, analytics and reporting refer to the systematic tracking, collection, and presentation of user behavioral data generated by your sent messages. Whenever you deploy an email campaign, your marketing software tracks how your recipients interact with that specific message.
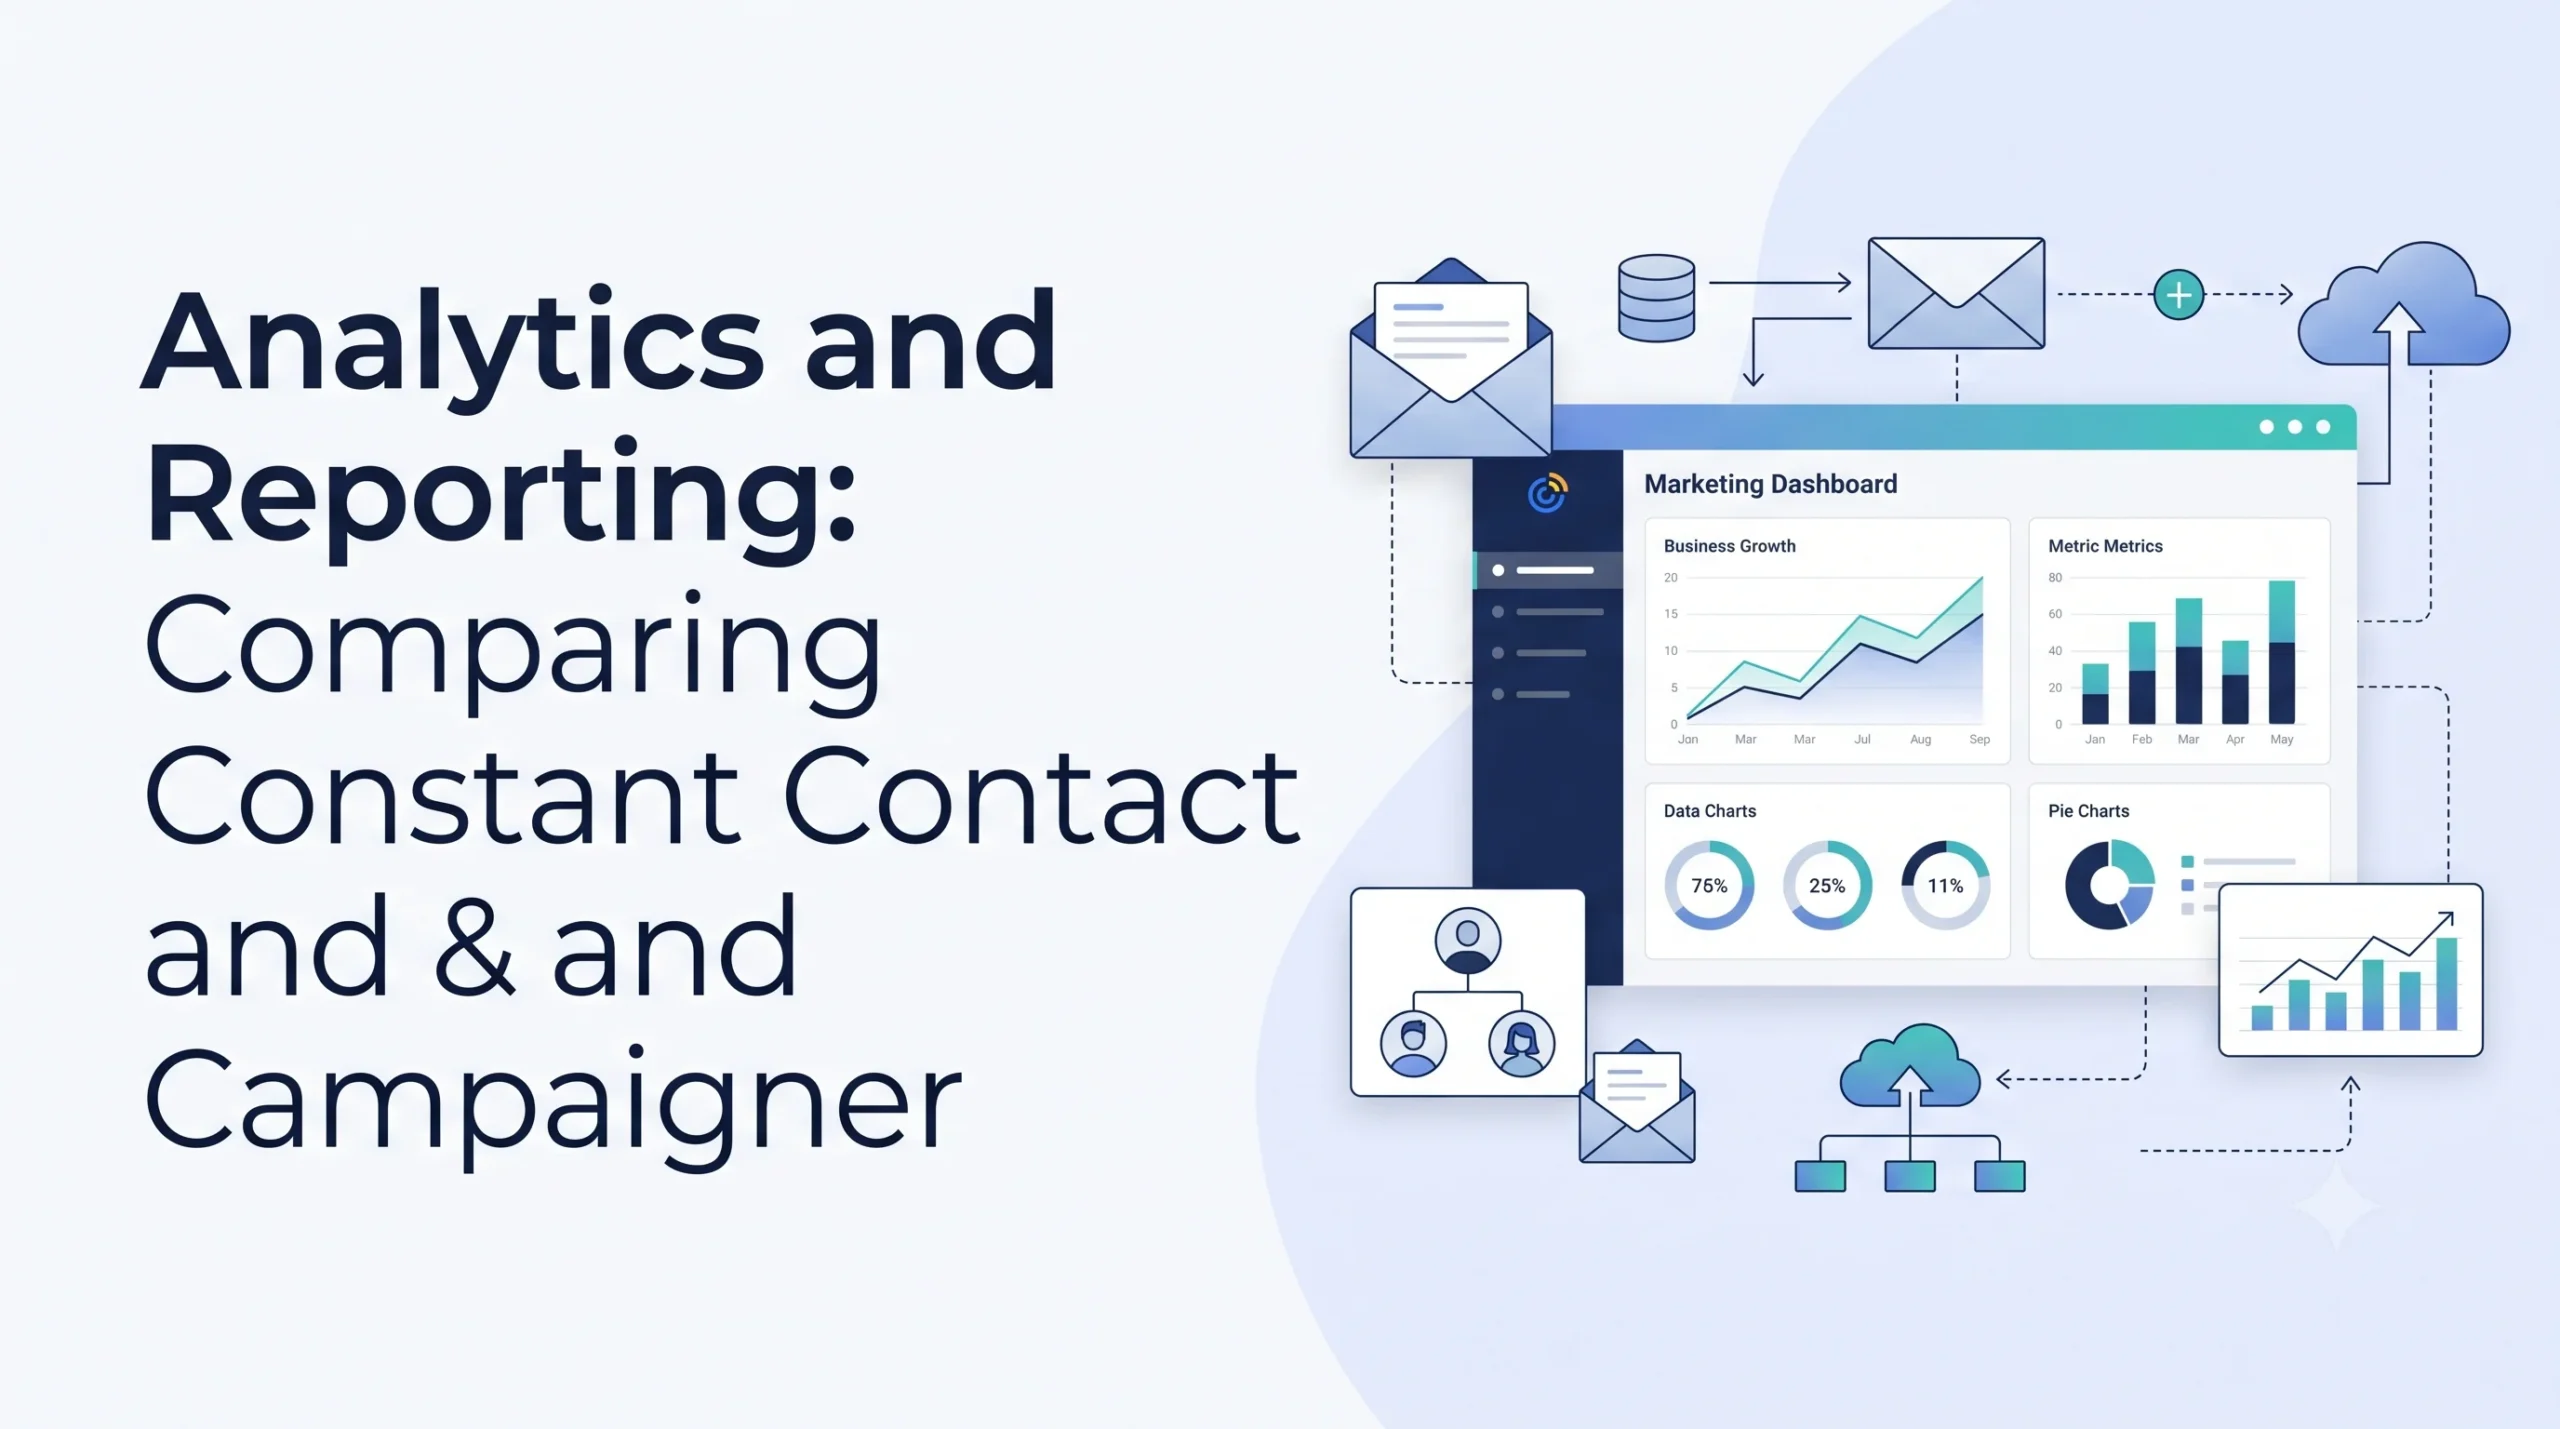
The software packages these distinct user actions into clear visual summaries, charts, and downloadable spreadsheets. Instead of guessing how your audience feels about your brand, analytics provide concrete proof of their engagement levels.
To get a firm grasp on the broader digital landscape that these tracking tools operate within, check out our comprehensive introductory guide, What Is Digital Marketing?
Why Data Tracking Is Crucial for Email Marketing Success
Data reports do much more than simply confirm that your emails were delivered successfully. They reveal the true health of your subscriber relationships and directly impact your long-term business growth.
Improving Audience Engagement
Data reports show you exactly what content resonates with your target market. By analyzing which links receive the most clicks, you can discover what topics, products, or educational guides your readers actually care about. This allows you to tailor future messages to their explicit interests, boosting overall performance.
Protecting Sender Reputation
Major email providers (like Gmail and Yahoo) continuously monitor how users interact with your messages. If your emails show high bounce rates or low engagement over an extended period, these providers may start routeing your campaigns directly into the spam folder. Consistent data monitoring helps you catch deliverability issues before they harm your sender reputation.
Optimizing Marketing Budgets
Every contact on your email list carries a financial storage cost. Analytics tools help you isolate inactive subscribers who have not opened an email in months. Cleaning these disengaged profiles from your database optimizes your budget and ensures you only pay for contacts who genuinely want to interact with your business.
How Email Analytics and Reporting Software Works
The moment you click “send” on a marketing campaign, a silent tracking process begins on the backend of your email service provider. This tracking relies on two core digital mechanisms: tracking pixels and custom URL redirects.
The Tracking Pixel (Open Rates)
To track open rates, your email software inserts a tiny, invisible graphic image (a 1×1 pixel) into the code of your HTML email. When a recipient opens the message, their email application automatically requests and downloads that image from your provider’s servers. That server request logs the email as “opened” alongside the exact time and date of the interaction.
Custom Redirect Links (Click-Through Rates)
Tracking clicks relies on a redirect process. When you add a hyperlink to your email layout, your software replaces that destination link with a unique, tracking-enabled URL pointing to their own servers. When a user clicks the link, they pass through your provider’s tracking script for a fraction of a second before arriving at your intended website destination.
[User Clicks Link] --> Passes Through Provider Server (Logs Click Data) --> Arrives at Your Website
To explore how these technical processes fit into your day-to-day newsletter operations, review our foundational guide on Email Marketing Basics.
Core Types of Email Metrics Explained
Before comparing software tools directly, it is helpful to understand the primary metrics found inside a standard performance dashboard.
1. Open Rate
The open rate represents the percentage of successfully delivered emails that were opened by your recipients. This metric serves as a strong indicator of how well your subject lines catch your audience’s attention.
2. Click-Through Rate (CTR)
The CTR tracks the percentage of email recipients who clicked on at least one hyperlink inside your email. This figure tells you how effective your email content, imagery, and call-to-action buttons are at driving reader engagement.
3. Bounce Rate
A bounce occurs when an email cannot be successfully delivered to the recipient’s inbox. Bounces are divided into two distinct categories:
- Soft Bounce: A temporary delivery failure, often caused by a full recipient mailbox or a brief server outage.
- Hard Bounce: A permanent delivery failure, resulting from a non-existent email address or a blocked domain. Hard bounces must be removed from your lists immediately.
4. Unsubscribe Rate
This metric shows the percentage of recipients who opted out of your email list after receiving a specific campaign. While a few unsubscribes are normal, a sudden spike indicates your latest content may have missed user expectations.
5. Conversion Rate
The conversion rate tracks the percentage of recipients who opened your email, clicked a link, and completed a specific desired action on your website, such as buying a product or filling out a form. For a deep dive into measuring these funnel actions, consult our Email Analytics Guide.
Benefits of Robust Analytics Platforms
Upgrading from basic tracking to an advanced analytics engine provides distinct business advantages that text and templates alone cannot deliver.
Confident Strategic Adjustments
Advanced reporting eliminates reliance on intuition. If the data shows your audience opens emails at a much higher rate on Tuesday mornings than Thursday afternoons, you can adjust your distribution schedules across your entire organization based on clear user evidence.
Streamlined Lead Nurturing
Sophisticated reporting tools allow you to pass engagement data directly into automated workflows. For instance, if a contact clicks a specific product link within a general newsletter, your software can automatically tag that user and place them into a tailored follow-up sequence. To see how these triggers function, explore Marketing Automation Explained.
Enhanced Personalization Through Grouping
By monitoring long-term reporting trends, you can easily group your audience into distinct clusters based on their engagement history. High-engagement users can receive special loyalty rewards, while inactive users can be directed into automated re-engagement paths. For strategies on organizing your contacts, read our Audience Segmentation Guide.
Challenges in Modern Email Reporting
While data tracking is highly valuable, modern marketers must navigate several systemic challenges to ensure their data remain accurate and compliant.
- Privacy-Driven Data Distortions: Privacy updates (such as Apple’s Mail Privacy Protection) block tracking pixels by pre-loading email content automatically on remote servers. This can cause email software to report artificially inflated open rates, forcing marketers to rely more heavily on click data and conversion metrics for accuracy.
- Data Fragmentation: If your email software does not integrate cleanly with your website analytics or your customer relationship management (CRM) database, your conversion data remains fragmented across separate dashboards.
- Dashboard Visual Overload: Many platforms present massive walls of raw data without clear context, making it difficult for beginners to distinguish minor background noise from critical performance trends.
Constant Contact vs. Campaigner: Analytics Feature Comparison
When evaluating Constant Contact and Campaigner, both platforms track foundational metrics like opens, clicks, bounces, and unsubscribes. However, their user interfaces, data structures, and advanced tracking depth cater to completely different user needs.
Constant Contact: User-Friendly and Visually Clear
Constant Contact structures its reporting dashboard around clean simplicity and quick scannability. It focuses heavily on providing intuitive visual graphs that show your performance metrics at a single glance.
Advantages of Constant Contact Analytics:
- Highly Intuitive Layout: The user interface uses simple charts and clear color coding, making it exceptionally approachable for small business owners and beginner marketers.
- Direct Mobile App Tracking: Their mobile application provides clean dashboard access on the go, allowing you to review live open and click trends directly from your smartphone.
- Simple Side-by-Side Comparison: The system allows you to select multiple historical campaigns and compare their performance metrics on a single screen without exporting data.
Limitations of Constant Contact Analytics:
- Basic Custom Reporting: Advanced users may find the custom report builder somewhat limited, as it lacks deep filtering options for multi-layered behavioral data.
- Standard Revenue Tracking: While it connects with popular e-commerce platforms, setting up complex attribution models to see exactly how a single link affected lifetime customer value can be difficult.
Campaigner: Deep Technical Data and Advanced Automation Insights
Campaigner approaches reporting with a heavy focus on technical depth, advanced testing parameters, and granular tracking controls. It is built explicitly for users who require highly customizable data reporting.
Advantages of Campaigner Analytics:
- Advanced Conversion Tracking: Campaigner allows you to plant detailed tracking scripts across your website, mapping specific online purchases and form fills directly back to individual email campaigns.
- Robust Multivariate Testing: While many tools only allow you to test two subject lines (A/B testing), Campaigner supports testing multiple variations of content, images, and send times simultaneously, providing comprehensive data reports for each variant.
- Granular Subscriber Inactivity Reports: The platform provides detailed tracking of subscriber inactivity patterns, allowing you to run precise database operations to segment or clean lists based on prolonged disengagement.
Limitations of Campaigner Analytics:
- Steeper Learning Curve: The reporting interface is dense with technical options and settings, which can feel overwhelming for non-technical users or absolute beginners.
- Longer Dashboard Setup Time: To unlock the full power of Campaigner’s advanced tracking, you must spend time configuring web tracking codes and custom fields, requiring a greater initial time investment.
Head-to-Head Analytics Comparison Table
| Analytics Feature | Constant Contact | Campaigner |
| Dashboard Design | Visual, clean, and beginner-focused | Dense, technical, and data-focused |
| A/B Testing Reports | Standard (Subject line and content) | Advanced (Multivariate testing options) |
| Website Conversion Tracking | Basic e-commerce integrations | Deep custom tracking scripts |
| Mobile Access | Comprehensive dedicated mobile app | Limited mobile browser view |
| Custom Report Building | Simple, pre-configured charts | Highly customizable data filters |
| Best Suited For | Small businesses wanting fast clarity | Experienced teams needing deep data segmentation |
Best Practices for Analyzing Email Performance Data
Regardless of which platform you select, executing these analytical habits ensures your reporting translates into real operational improvements:
- Prioritize Click Data Over Open Rates: Because modern privacy settings can distort open rates, focus on link clicks and conversions. A click requires a deliberate user action, making it a much more dependable gauge of interest.
- Establish Clear Performance Benchmarks: Avoid analyzing your campaigns in complete isolation. Compare your metrics against your own historical averages and broader industry standards to understand if your performance is strong.
- Act Promptly on Hard Bounce Data: Ensure your platform is configured to automatically remove hard bounces from your active mailing lists immediately. Allowing hard bounces to persist degrades your delivery rates across all inbox providers.
- Test One Explicit Variable at a Time: When running tests to optimize performance, only alter one element per campaign (such as just the subject line or just the main image button). If you change multiple elements at once, you cannot determine which modification caused the shift in results.
Common Reporting Mistakes to Avoid
Watch out for these frequent analytical traps to protect your data integrity:
- Obsessing Over Vanity Metrics: High open counts feel rewarding, but if those visitors do not click through to your site or convert into buyers, your campaign is not meeting its core business objectives. Focus on metrics that impact your revenue.
- Reviewing Campaign Data Too Quickly: Avoid making definitive strategic changes based on reports pulled just two hours after clicking send. Allow your data to accumulate for at least 48 to 72 hours to ensure you capture the vast majority of user opens and clicks.
- Failing to Clean Out Inactive Contacts: Keeping hundreds of unengaged users on your list simply to maintain a larger subscriber count lowers your overall engagement percentages and inflates your software subscription costs.
- Ignoring Deliverability Warning Signs: If your open rates suddenly drop by 50% across a single week, do not assume your audience simply disliked the subject line. This pattern often points to a deliverability issue where your messages are being rerouted to the spam folder.
Real-World Analytics Scenarios
Let’s look at how two different business types utilize these specific analytics approaches to refine their digital strategy.
Scenario A: The Growing Local Boutique
A local boutique owner uses Constant Contact to send weekly style updates. They do not have a dedicated data analyst on staff.
By checking the platform’s visual charts on their phone every Friday, they notice that emails featuring product video links get double the clicks of text-heavy updates. They adapt their content plan quickly, focusing heavily on short video features to match clear user behavior.
Scenario B: The Digital Software Publisher
A scaling software provider launches a complex multi-step automated campaign using Campaigner. Their technical marketing team sets up tracking codes across their product download pages.
By analyzing detailed multivariate testing reports, they discover that a specific combination of a personalized subject line and a blue call-to-action button yields a 4% higher conversion rate. They roll out this high-performing layout across their entire automation system, maximizing their software trial signups.
Selecting Your Core Reporting Software
When deciding between Constant Contact and Campaigner for your email analytics, you should evaluate the data complexity your team can comfortably manage. Both platforms offer stable delivery systems, but they process and present information through completely different design philosophies.
To help guide your choice, look closely at your organizational resources:
- Constant Contact serves as an excellent option if you are a solopreneur, small business owner, or general marketer who needs clear, scannable data visualization without getting bogged down in complex technical setups.
- Campaigner fits perfectly if you are an established digital marketer, e-commerce brand, or data-driven team that requires intricate conversion tracking, multi-layered data filtration, and detailed multivariate testing tools.
Before committing your marketing budget to either software platform, consider signing up for an introductory free tier or a comprehensive trial period. Take a few test lists, send a sample broadcast, and spend time navigating the reporting backend yourself. Ensure the charts, menu options, and export features align naturally with your team’s tracking workflows. For a comprehensive framework on making this software decision, consult our specialized guide: How to Choose an Email Marketing Platform.
Frequently Asked Questions
Why do my email open rates look unusually high?
Unusually inflated open rates are frequently caused by privacy features like Apple Mail Privacy Protection. These systems automatically download email tracking pixels onto secure proxy servers before the user even opens the message, causing your email platform to register an open automatically.
What is a healthy click-through rate for email campaigns?
While average figures vary significantly across different industries, a healthy email click-through rate generally sits between 2% and 5%. Rather than comparing your site strictly to external standards, focus on steadily improving your own historical averages over time.
How do soft bounces differ from hard bounces?
A soft bounce represents a temporary delivery issue, such as a full inbox or a brief server issue, and your platform will usually attempt to redeliver the message. A hard bounce signifies a permanent delivery error, such as a deleted or invalid email address, and must be purged from your system immediately.
Can I track actual website sales back to a specific email?
Yes, using website conversion tracking. Advanced tools like Campaigner allow you to place a tracking script on your checkout page, allowing the system to match successful purchases directly back to the specific email campaign and link the user clicked.
How often should I check my email marketing analytics?
You should monitor your active campaign reports 48 to 72 hours after distribution to see how your latest message performed. On a macro level, review your overall database growth, deliverability metrics, and unsubscribe trends monthly to guide long-term strategy decisions.
Data Management Checklist
Use this checklist to ensure your email data collection remains accurate and actionable:
- [ ] Confirmed your email tracking scripts are properly installed on your website pages.
- [ ] Set up an automated system to remove hard bounces and spam complaints instantly.
- [ ] Defined your primary performance metrics based on clicks and conversions over open rates.
- [ ] Scheduled a recurring monthly list cleaning session to isolate and address inactive users.
- [ ] Established a baseline of your average performance metrics to measure future campaign improvements.
Conclusion
Data tracking is the engine that drives sustainable email marketing growth. Whether you select the visually intuitive, beginner-friendly dashboards of Constant Contact or the technically deep, advanced conversion tools of Campaigner, the secret to success lies in consistent execution.
Do not let your performance data sit unexamined on a software backend. Review your clicks, monitor your deliverability metrics, clean your contact lists regularly, and continuously use your reporting insights to deliver highly relevant, valuable content to your subscribers.